- See also
- References
| name = np-chart
| proposer = Walter A. Shewhart
| subgroupsize = n > 1
| measurementtype = Number nonconforming per unit
| qualitycharacteristictype = Attributes data
| distribution = Binomial distribution
| sizeofshift = ≥ 1.5σ
| meanchart = Np control chart.svg
| meancenter =

| meanlimits =
| meanstatistic =

}}
In statistical quality control, the np-chart is a type of control chart used to monitor the number of nonconforming units in a sample. It is an adaptation of the p-chart and used in situations where personnel find it easier to interpret process performance in terms of concrete numbers of units rather than the somewhat more abstract proportion.[1]
The np-chart differs from the p-chart in only the three following aspects:
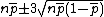
- The control limits are
 , where n is the sample size and
  is the estimate of the long-term process mean established during control-chart setup.
 - The number nonconforming (np), rather than the fraction nonconforming (p), is plotted against the control limits.
- The sample size,
 , is constant.
See also
- p-chart
References
1. ^{{cite book | last = Montgomery | first = Douglas | title = Introduction to Statistical Quality Control | publisher = John Wiley & Sons, Inc. | year = 2005 | location = Hoboken, New Jersey | pages = 279 | url = http://www.eas.asu.edu/~masmlab/montgomery/ | isbn = 978-0-471-65631-9 | oclc = 56729567 | deadurl = yes | archiveurl = https://web.archive.org/web/20080620095346/http://www.eas.asu.edu/~masmlab/montgomery/ | archivedate = 2008-06-20 | df = }}
{{DEFAULTSORT:Np-Chart}} 2 : Quality control tools|Statistical charts and diagrams
- Credit debt
- Credit Default Swap
- Credit Default Swap Index
- Credit default swap index
- Credit derivative risks
- Credit du Nord
- Credit enhancement
- Credit Europe Bank
- Credit event
- Credit fixer
- Credit fixing
- Credit Foncier
- Credit freeze
- Credit history (United States)
- Credit hour
- Credit hours
- Credit Industriel et Commercial
- Credit institution
- Credit institutions
- Credit Institutions
- Credit Island
- Creditist Realignment
- Creditist Realignment of Quebec
- Credit line
- Credit linked note